The Sub-Metering Imperative: Why Utility-Level Energy Data Is No Longer Enough
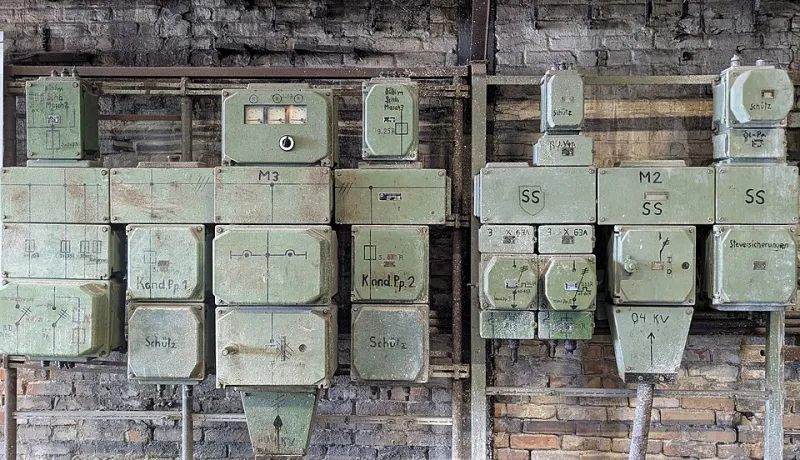
Photo: Siarhei Besarab, CC BY-SA 4.0, via Wikimedia Commons
The monthly utility bill arrives, and the number is larger than expected. The operations team reviews it, notes the increase, and moves on—because without more granular data, there is nothing actionable to do with that information. This scenario plays out at industrial and commercial facilities across the United States with remarkable consistency, and it points to a fundamental gap in how most organizations approach energy visibility.
The utility meter at the service entrance is a single measurement point. It captures total consumption for the entire facility over the billing period. It cannot tell you which production line drove the spike on the fourteenth of the month, whether your compressed air system is leaking energy during third shift, or what your conveyor control panels are drawing at two in the morning when the plant is nominally idle. For that level of insight, you need data at the circuit and equipment level—and most facilities simply do not have it.
What Aggregate Data Cannot Show You
Energy management decisions made from utility bill data alone are, at best, directional. They can tell you that consumption is trending upward or that this quarter's costs exceeded last quarter's. They cannot tell you why, and they cannot tell you where to intervene.
This matters because energy inefficiency in industrial environments is rarely distributed evenly. It tends to concentrate. A single aging chiller operating with degraded refrigerant charge may account for a disproportionate share of HVAC energy consumption. One production line running with a misaligned drive may draw 15 percent more power than its counterparts performing identical work. A bank of control panels left in full-power mode during weekend shutdowns may represent thousands of dollars in annual consumption that appears nowhere in any operational report.
Without measurement at the source, these concentrations remain invisible. Efficiency initiatives targeting the wrong systems produce marginal results, and the actual sources of waste continue uninterrupted.
The Architecture of Granular Monitoring
Sub-metering systems vary considerably in scope and sophistication, and the right architecture for any facility depends on its size, complexity, and operational priorities. That said, a few structural principles apply broadly.
Branch circuit monitoring installs current transformers on individual circuit breakers within a panel board, capturing load data for each circuit independently. This level of granularity is particularly valuable in facilities with diverse loads served from common distribution panels, where individual equipment contributions to overall consumption are otherwise impossible to isolate.
Process-level metering instruments specific production systems, lines, or zones as discrete measurement points. This approach enables direct comparison of energy intensity across production units—an essential capability for facilities pursuing continuous improvement programs or benchmarking energy performance against production output.
Power quality monitoring goes beyond simple consumption measurement to capture voltage harmonics, power factor, current imbalances, and transient events. This dimension of monitoring is frequently overlooked, yet power quality issues routinely impose costs that never appear on the utility bill as a separate line item—they manifest instead as premature equipment failures, elevated demand charges, and reduced motor efficiency.
Idle-State Consumption: The Load That Shouldn't Be There
One of the most consistently valuable findings from granular sub-metering programs is the quantification of idle-state consumption—the energy a facility uses when it is not producing anything.
For facilities operating single or double shifts, idle-state consumption during off-hours, weekends, and planned shutdowns can represent a surprisingly large fraction of total monthly usage. Lighting systems left on in unoccupied areas, HVAC units continuing to condition spaces that are not in use, equipment in standby modes drawing continuous parasitic loads, and control systems maintaining full-power states through non-production periods all contribute to a baseline consumption that has nothing to do with output.
Facilities that have deployed sub-metering and specifically analyzed their off-hours load profiles frequently discover that idle consumption accounts for 15 to 25 percent of total monthly electricity use. In absolute terms, for a mid-sized manufacturing plant with a $500,000 annual energy budget, that represents $75,000 to $125,000 in consumption that is generating no production value whatsoever.
Identifying and addressing those loads requires circuit-level data. It cannot be accomplished from the utility meter.
Harmonic Distortion and Its Hidden Costs
Power quality monitoring deserves a separate discussion because its financial implications are frequently underestimated. Modern industrial facilities are densely populated with variable frequency drives, switching power supplies, electronic lighting controls, and other non-linear loads that introduce harmonic currents into the electrical distribution system.
These harmonics are not benign. They increase effective current flow in conductors and neutral wires, accelerate insulation degradation, cause transformers to run hotter than their ratings anticipate, and can interfere with sensitive control systems. They also reduce power factor, which—depending on the facility's utility rate structure—can trigger power factor penalties that appear on the monthly bill without any clear explanation of their origin.
Power quality monitoring identifies harmonic sources, quantifies their magnitude, and provides the data needed to evaluate mitigation options such as harmonic filters, phase-shifting transformers, or drive parameter adjustments. The cost of unaddressed harmonic distortion in a facility with significant non-linear load density can be substantial, and it is entirely invisible without the appropriate instrumentation.
The Return on Monitoring Investment
A common objection to sub-metering programs is cost. Instrumentation, installation, data infrastructure, and ongoing maintenance all carry price tags, and in a capital-constrained environment, the business case must be clear.
The experience of facilities that have made this investment is instructive. In most cases, the efficiency improvements identified through granular monitoring—idle load reduction, demand peak management, process optimization, power quality correction—produce savings that recover the monitoring investment within months rather than years. For larger facilities with complex load profiles, the payback period is frequently measured in weeks once identified savings are acted upon.
More importantly, sub-metering creates a permanent capability. Unlike a one-time audit that produces a snapshot, continuous monitoring enables ongoing performance verification, rapid detection of emerging inefficiencies, and a data foundation for future energy strategy decisions.
The utility meter at your service entrance is a starting point, not a destination. Facilities that treat it as sufficient will continue making energy decisions in the dark. Those that invest in circuit-level visibility gain something more valuable than data—they gain the ability to act with precision.